Customer Satisfaction Analysis with FRED
If you just want to collect numbers that describe the degree to which your customers are happy with your product or service, there are a thousand ways to do that. But if you want to really understand what the numbers are telling you and what you should do about it, FRED can tell you that.
FRED stands for Fast Retail Evaluation Device. And please don’t get the wrong idea – the software works quite well in realms other than retail as well.
FRED doesn’t assume it’s as easy to please customers in one trade area as in another. Nor does it assume that customers in one trade are pleased by the same things as customers in another trade area.
Instead, FRED assumes that different groups of people are moved by different things, and when you put a store in their area you have to conform to their wishes. FRED simply tells you how to do that. The program does this by using the concept of trade-area equilibrium.
Consumer Satisfaction and Trade-Area Equilibrium
Retail trade-area equilibrium is a condition in which the needs of the people in the trade area surrounding a store have been almost perfectly satisfied by the offerings at that store. It is an ideal condition, never fully achieved by any store.
By this logic, a “leader” store will have minimized the difference between this ideal condition — equilibrium — and its actual condition. Correspondingly, a “laggard” store will have maximized the difference between equilibrium and its actual condition.
Said Less Formally…
Conceivably, you could go to all the people in a trade area and ask them what they’re looking for in a store. When you retrieve all their answers, you could create a picture of the perfect store for that trade area. This “perfect store” we call an exemplar.
Companies place stores in trade areas, doing their best to make their offerings in that store fit what the people in the trade area want. But it never really works out perfectly. There are always situations in which the store planners miss the mark. For example, they may think the trade area needs a terrific bakery in the store, so they put a lot of time and money into the bakery, then realize that the trade area really didn’t need such a nice bakery. In this case, they put their money into the wrong thing and the people in the trade area wind up visiting that store less because it doesn’t have what they want.
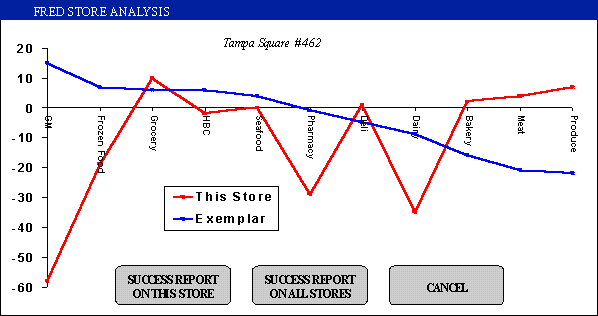
In the example above, we are examining a laggard store. What makes it a laggard?
As you you can see, the exemplar for that trade area is satisfying people quite well on General Merchandise (GM), but this particular store is not. Further, you can see that this store is satisfying people quite well with their bakery department, but the people of that trade area weren’t really asking for a great bakery, by comparison with other things.
If you were to determine the total area between the peaks and valleys of the red curve and the smooth line of the blue curve, you’d have some idea of the extent to which this store fails to provide the people of the trade area what they want.
Now You Can Do Much More
When you learn to look at customer satisfaction in this way, you can use FRED to:
- Plan the departments, attributes, service offerings, and space allocations of a store to maximize the chances of high consumer satisfaction for the trade area.
- Evaluate the likely success of several different strategies to fix a customer satisfaction problem.
- Continuously track the progress of customer satisfaction, so you can make certain your chosen strategies are working as you planned.
For more information, please contact Cascade Strategies at (425) 677-7430. Or e-mail us at cascade@mktgdatascience.org


